Frequently Searched

Education Savings Accounts Serving Low-Income Communities

The Impact of ESAs in Arizona, Part II

November 19, 2019

Matt Beienburg

Director of the Van Sittert Center for Constitutional Advocacy and Director of Education Policy

The Goldwater Institute


Introduction & Executive Summary

At the core of the school choice movement is the aspiration that every family obtain the freedom to pursue educational excellence for their children—regardless of their geographic location or socioeconomic background. Yet opponents have cast this movement as providing aid to the wealthy at the expense of the poor.

This claim has been used to galvanize parents and public school advocates to condemn choice options as harmful to both equity and the educational system at large, and it was among the leading arguments used to defeat the expansion of Arizona’s education savings account program in the state’s 2018 ballot measure, Proposition 305.

Despite its political potency, however, this narrative against school choice is increasingly faltering under the weight of empirical evidence. As the left-leaning Urban Institute found in 2019, for example, “the country’s largest private school choice program [the Florida Tax Credit scholarship program], which enrolls largely low-income students from low-income schools, has a positive effect on college-going and graduation rates.”

Now, new findings from Arizona further make clear that the Grand Canyon State, like Florida and many others, is lifting up low-income communities through school choice.

This report documents the success of Arizona’s education savings account program—known more formally as the Empowerment Scholarship Account (ESA) program—in reaching those who are most in need. Among its key findings are the following:

  • The average ESA award covers 100% of the median private elementary school tuition and fee rate in Arizona, putting private education within financial reach of even the most economically disadvantaged.
  • ESA students come from low-performing, low-income school districts in similar proportions as public school students overall, and contrary to previous claims, ESAs generate equitable funding for students regardless of their economic background.
  • The 10 districts where ESAs are most popular in Arizona are overwhelmingly socioeconomically disadvantaged. The three districts with the highest concentrations of ESA students have child poverty rates more than double the state average.
  • ESAs serve hundreds of students from Native American reservations, where public school spending can exceed $16,000 a year, yet where thousands of students are trapped in public schools rated D or F by the State Board of Education.
  • ESAs serve low-income, urban communities such as the Roosevelt Elementary School District in Phoenix, where more than 100 students now use an ESA, where most neighborhoods are within 2 miles or less of a private school, and where the average ESA award fully covers tuition at 80% of K-8 private schools within the district’s boundaries.


Private Education Only for the Wealthy?

One of the most frequent questions about ESAs is whether they are able to bring the high costs of private school tuition within financial reach of middle- and lower-income families, rather than helping only the most affluent. This concern seems especially reasonable considering that EdChoice researcher Andrew Catt documented in Exploring Arizona’s Private Education Sector that private elementary school tuition and fee rates reached as high as $29,700 per year as of FY 2017, with certain high schools costing even more.

In comparison, ESA awards for non-kindergarten, non-special education students averaged $6,148 in FY 2019, clearly too little to cover a private school tuition bill nearing $30,000. Yet this comparison turns out to be incredibly inadequate and masks the true value of ESAs.


ESAs Award Amounts Fund Up to 100% of Private School Tuition

Perhaps the most surprising fact to most about Arizona’s ESA program is that it is sufficient to cover almost 100% of tuition at private elementary and middle schools throughout the state.

Indeed, though Catt finds that private elementary school tuition can reach $29,700 a year, that number reflects the price tag of only the most expensive outliers among Arizona private schools. In fact, the same report reveals that the median tuition and fee rate at the state’s private elementary schools was $5,675 in FY 2017. Even adjusting this amount for inflation, that cost rises to approximately $6,139 as of FY 2019, an amount virtually identical to the average ESA award.

This means that rather than putting a small dent in a large tuition bill, ESAs can fully cover tuition and fees at the majority of private elementary schools in Arizona, making them affordable to families from all across the socioeconomic spectrum.

Similarly, the average ESA award covers over 90% of the median tuition and fee costs of private middle schools ($6,599, adjusted for inflation). Not until the high school level does median tuition ($10,277 adjusted for inflation) more significantly outpace comparable award amounts of an ESA.


While variation exists among ESA award amounts (even among non-special education students), program data from FY 2019 makes it clear that virtually all ESA students are receiving awards that put these private elementary and middle school tuition costs within reach.  In fact, the median (non-kindergarten, non-special needs) ESA award amount ($6,166) is slightly higher than the average ESA amount ($6,148), confirming that the findings above apply to the typical program participant.


ESAs Serve Students from High- and Low-Performing Districts Alike

Despite the ability of ESAs to fully cover private school tuition costs, prior analyses have suggested that they provide inadequate financial support for middle- or lower-income families and disproportionately benefit the wealthy. For example, the state’s largest newspaper, the Arizona Republic, has featured an annually recurring story under the following headlines:

“State money helping wealthier Arizona kids go to private schools” (2016), “Arizona taxpayer-funded vouchers benefiting students in more-affluent areas” (2017), “Vouchers still mostly go to students leaving wealthier, higher-performing districts” (2018).

As the basis of its findings, the paper has stated that ESA students “disproportionately [come from] wealthier and higher-performing school districts. … Nearly 70 percent of the money from the voucher-like Empowerment Scholarship Accounts is being used by students leaving A- or B-rated districts to attend private schools.”

The claim that ESA students come disproportionately from these wealthier and higher-performing districts is false, however. And it turns out that when actually measured this way, ESA students are almost perfectly representative of Arizona’s public school population overall.

Specifically, while it is true that that the majority of ESA students come from A- and B-rated districts, so do the majority of Arizona’s public school students. In fact, the proportion of ESA students coming from A- and B-rated districts in FY 2019 (approximately 60%) was slightly lower than the proportion of public school students who attend A- and B-rated districts (approximately 65%), suggesting that if anything, ESA students disproportionately come from less advantaged communities than their peers. (Since students from D- and F-rated schools or districts can qualify for an ESA without meeting additional eligibility criteria, this is exactly what we would anticipate.)

Similarly, the same Republic analyses imply that wealthy families receive greater benefits from the program than lower-income peers: “[J]ust like findings in 2017 and 2016, the Republic again found ESA awards from students exiting higher-performing and wealthier schools are much larger: an average of $15,000 per pupil from A and B schools, compared with an average of $8,000 for D and F schools” in FY 2018.

In other words, the findings suggest that ESA families from wealthier areas receive ESA award amounts that are nearly twice as generous as those given to students from less advantaged communities.

Unfortunately, while the Republic at least acknowledges that ESA award amounts are impacted by special education status, its narrative makes no attempt to meaningfully clarify that the supposed disparity in award amounts is entirely the result of the extra funding received by students who are blind, deaf, or have other special needs.

In fact, the average ESA award amount for non-special needs students from A and B districts was approximately $6,100 in FY 2019, virtually identical to the $6,200 average for non-special needs students from C, D, and F districts. Likewise, ESA awards for students with severe special needs average approximately $26,700 whether they come from high- or low-performing districts.

In short, this fuller analysis confirms that ESA recipients receive virtually identical funding, regardless of the wealth or academic performance of their local school district.

Furthermore, equity within the ESA program becomes even more apparent when looking at explicitly economic data.


ESAs Serve Students from Higher- and Lower-Poverty Communities Alike

Official U.S. Census data (used to calculate Arizona schools’ FY 2020 federal Title I allocations for low-income students) states that 19.26% of Arizona children aged 5 to 17 live in poverty.

If ESAs equitably serve communities from across the socioeconomic spectrum, then we would expect ESA students to be coming from school districts with above- and below-average poverty rates in numbers similar to those of public school students overall. (That is, we would expect a similar percentage of ESA and public school students to come from districts with poverty rates above 19.26%, and a similar percentage of ESA and public school students to come from districts with poverty rates below 19.26%.)

The data indeed confirms this to be true: ESA students come from school districts with above-average and below-average poverty rates at broadly equal rates and in virtually identical proportions as traditional public school students overall.

Specifically, 49.7% of traditional public school students attended school districts with above-average poverty rates, similar to the 49.2% of ESA students who came from above-average poverty districts. Conversely, 50.3% of traditional public school students attended school districts with below-average poverty rates, compared to a similar 50.8% among ESA students.

In other words, the proportion of ESA students from comparatively poorer or wealthier areas closely mirrors that of traditional public school students.

While this analysis provides only a district-level snapshot of ESA participation, it makes clear that ESA usage is broadly representative of the Arizona district school population as a whole.


Economically Disadvantaged Communities Use ESAs More than Any Other

Perhaps more strikingly, the Census and ESA program data reveals that the highest concentrations of ESA usage actually occur in the most severely economically disadvantaged communities in Arizona. Among the 10 districts with the highest share of ESA students (as a percentage of each district’s overall student enrollment), eight have higher than average child poverty rates. In fact, the three districts with the highest concentrations of ESA students in the entire state have child poverty rates more than double the state average.

In the San Carlos Unified School District, for example, 111 students participated in the ESA program in FY 2019. This translates to 7.3% of the district’s total K-12 enrollment, the highest concentration of ESA students among any district in the state. And contrary to concerns that ESAs chiefly benefit the wealthy, nearly half (46.4%) of children aged 5 to 17 in San Carlos live in poverty.


San Carlos Unified, like several of the other districts with the highest rates of ESA usage, falls within Native American reservation lands, where all students are automatically eligible for an ESA. While it is unsurprising that a higher share of students would use the program in these districts compared to others where only select students qualify, San Carlos’ ESA participation rate remains more than double that of other student populations who similarly all qualify for the program.

Indeed, the extraordinarily high ESA participation rates among low-income Native American communities dramatically undermines one of the chief arguments put forward against ESAs—namely that they fail to offer meaningful relief to the most disadvantaged.

To the contrary, the 111 ESA students from San Carlos Unified, like the 117 from Window Rock Unified and the 128 from Whiteriver Unified—all three districts where child poverty rates exceed 35%—seem to have found educational opportunity that had been absent in their traditional public school settings.


ESAs Succeed Where Funding Increases Do Not

Moreover, these districts provide an extraordinary case study showing that the promotion of school choice—rather than simply an increase in school funding—may be the key to improving educational opportunity for many of the most disadvantaged. Whereas the Arizona Auditor General reports that the average per pupil spending on district school students statewide was $9,929 in FY 2018, the average per pupil spending at Whiteriver Unified was $12,401, over $3,000 more than the state average per student. At San Carlos and Window Rock, public school spending rises even higher, to $15,776 and $16,149 per student per year, respectively.

Yet these exceptionally high per pupil spending amounts within the public school districts have failed to translate into academic opportunity for students. Within San Carlos, for example, 100% of the district’s schools received a D or F rating from the State Board of Education. (This translates to over 1,400 students being trapped in failing schools in this district alone).  In Whiteriver, all 5 of the district’s schools posted a C, D, or F rating, as did the majority of schools in Window Rock Unified.

In contrast to the public school spending amounts that reach up to $16,000 per pupil, the average (non-kindergarten, non-special needs) ESA award for students from Native American reservations totaled just $6,219 in FY 2019, meaning they cost up to $10,000 less per student per year than the surrounding public school systems. Yet even at this substantially lower cost, ESAs provide enough funding to cover up to 100% of tuition costs at nearby private schools, providing students opportunity where often none existed before.


ESAs Offer Hope to Low-Income, Urban Families

Just as they have given new opportunity to students from Native American communities, ESAs likewise serve students living in some of the most disadvantaged urban areas of Arizona’s capital city.

For example, the Phoenix-area school district with the single highest proportion of D- and F-rated public schools (53%), Roosevelt Elementary School District, saw over 100 students participate in the ESA program in FY 2019. Far from a wealthy suburb, the district serves a student body that is 93% Hispanic and African American, and like many of the Native American communities above, it has one of the state’s highest child poverty rates, 29.9%.

With nine public schools rated as a D or F, eight schools rated C, and not a single school rated as an A or B by the State Board of Education in FY2018, Roosevelt Elementary would constitute one of the few cases in which an entire district would likely receive a D or F rating, triggering automatic ESA eligibility for all students residing within the district. However, since the State Board of Education no longer assigns formal district level ratings—meaning that analyses such as the Arizona Republic’s aforementioned report have had to simulate overall district scores—families within the Roosevelt District do not enjoy the same assurance of universal eligibility afforded to students within the geographic boundaries of the Native American reservations.

Nonetheless, the 101 students from the Roosevelt district who opted for ESAs prove that the program provides a lifeline to highly disadvantaged neighborhoods.

And further, Roosevelt offers a powerful example of school choice serving low-income families in two specific ways: providing options that are geographically accessible and economically affordable.

As shown in the figure below, private school options abound within the district. In addition to roughly a dozen tuition-free public charter schools, Roosevelt’s boundaries contain six private schools serving elementary and/or high school students. As a result, the majority of Roosevelt lies within about 2 miles or less of a private school, with choice options often falling even closer when taking into account the charters as well.


Not only do private options exist throughout the district, but 80% (4 out of 5) of private schools serving K-8 students do so at tuition rates below the average ESA award value within that district. This means that any family living within Roosevelt could access private school education at zero cost through an ESA.


Conclusion

It is clear that Arizona’s ESA program offers opportunity to students from across the socioeconomic spectrum. Indeed, not only are low-income Arizona families finding opportunity to use ESAs for at-home curriculum materials, tutoring, and other independent learning opportunities, they are increasingly discovering that the program provides enough funding to pay up to 100% of the costs of private school tuition throughout the state, bringing private education within financial reach.

With the state’s highest ESA participation rates coming from some of its most disadvantaged communities—including Native American reservations—and new evidence showing that per pupil spending in nearby public schools can cost up to $10,000 more per student than ESAs and the private school tuition costs they cover, it is perhaps time to renew the public dialogue on the ability of ESAs to serve those most in need. It is perhaps time for Arizonans to once again take pride in the educational choices their state offers its families.


End Notes

1 Matthew Chingos, Tomas Monarrez, and Daniel Kuehn, The Effects of the Florida Tax Credit Scholarship Program on College Enrollment and Graduation, Urban Institute, February 2019, https://www.urban.org/research/publication/effects-florida-tax-credit-scholarship-program-college-enrollment-and-graduation.

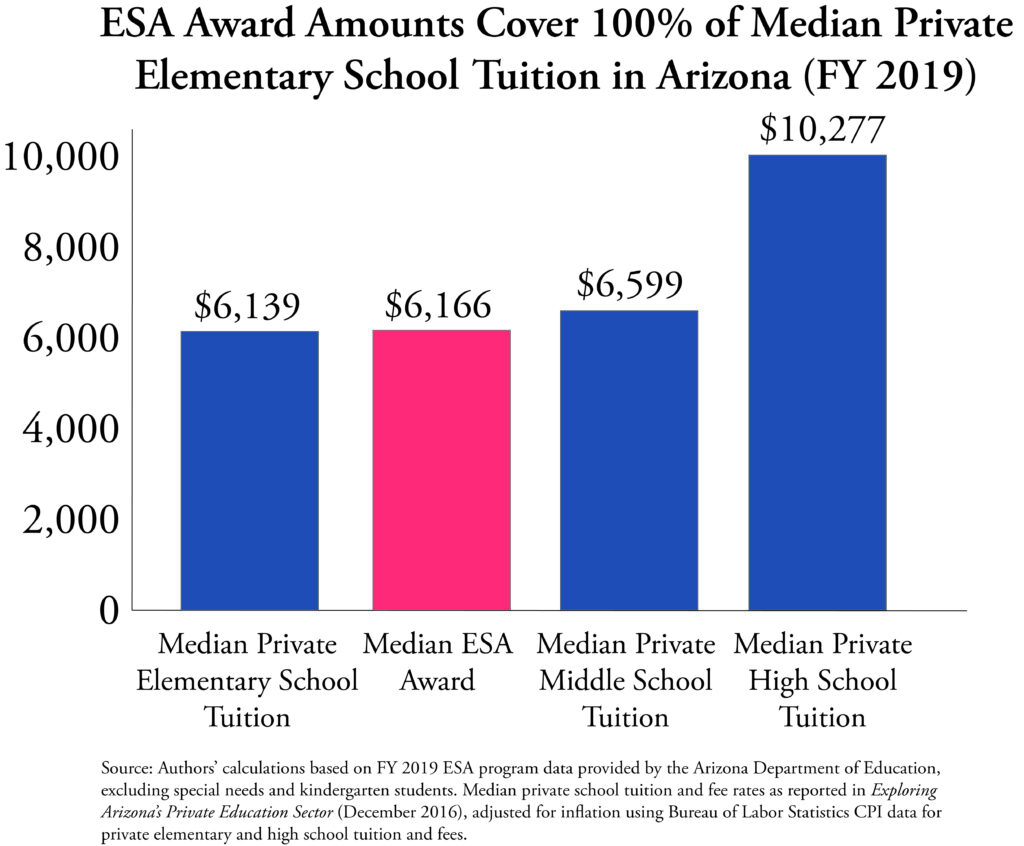
2 Andrew D. Catt, Exploring Arizona’s Private Education Sector, EdChoice, December 2016, https://www.edchoice.org/wp-content/uploads/2016/12/Exploring-Arizonas-Private-Education-Sector-by-Andrew-D-Catt.pdf.

3 Matt Beienburg, The Public School Benefits of Education Savings Accounts: The Impacts of ESAs in Arizona, Goldwater Institute, August 2019, https://www.goldwaterinstitute.org/wp-content/uploads/2019/08/Public-School-Benefits-of-ESAs_web.pdf.

4 Catt, Exploring Arizona.

5 Authors’ calculations using Bureau of Labor Statistics inflation data. “CPI-All Urban Consumers (Current Series): Elementary and high school tuition and fees in U.S. city average, all urban consumers, not seasonally adjusted.” CPI change from December 2016 – December 2018. Accessed October 14, 2019, https://data.bls.gov/timeseries/CUUR0000SEEB02?output_view=data.

6 Catt, Exploring Arizona.

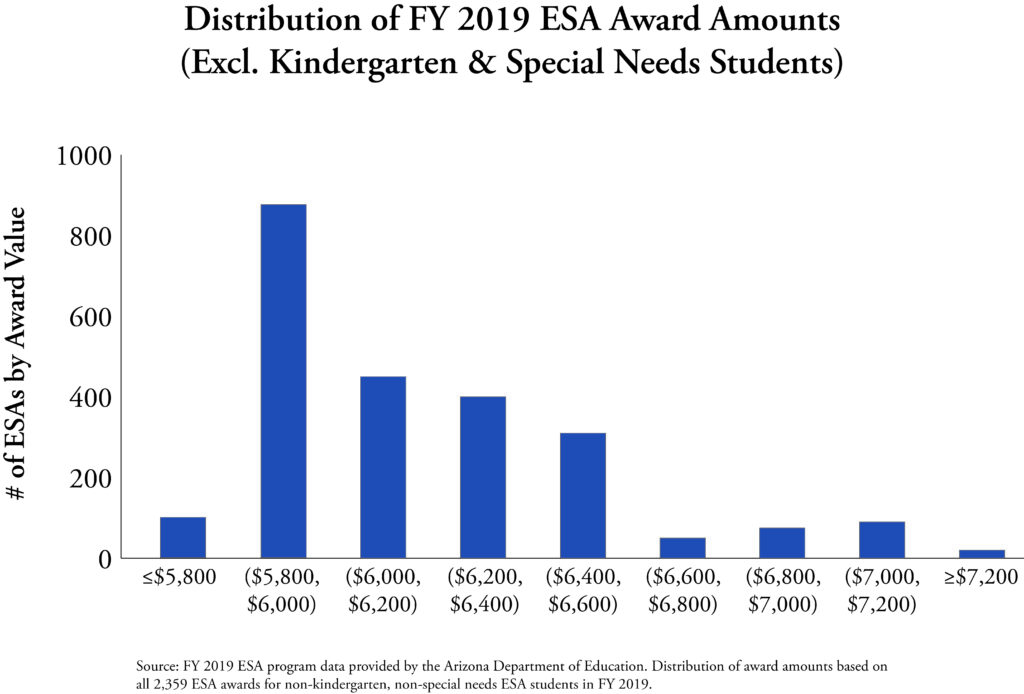
7 Authors’ calculations based on FY 2019 ESA program data provided by the Arizona Department of Education, excluding special needs and kindergarten students.

8 Rob O’Dell and Yvonne Wingett Sanchez, “State Money Helping Wealthier Arizona Kids Go to Private Schools.” Arizona Republic, February 23, 2016, https://www.azcentral.com/story/news/arizona/politics/education/2016/02/23/state-money-helping-wealthier-arizona-kids-go-private-schools/80303730/; Rob O’Dell and Yvonne

Wingett Sanchez, “Arizona Taxpayer-Funded Vouchers Benefitting Students in More-Affluent Areas,” Arizona Republic, March 30, 2017, https://www.azcentral.com/story/news/politics/arizona-education/2017/03/30/arizona-taxpayer-funded-vouchers-benefiting-students-more-affluent-areas/99707518/; Rob O’Dell, “Prop 305: Vouchers Still Mostly Go to Students Leaving Wealthier, Higher-Performing Districts,” Arizona Republic, October 25, 2018, https://www.azcentral.com/story/news/local/arizona-education/2018/10/25/voucher-students-leave-high-performing-schools-private-schools/1734678002/.

9 O’Dell, “Prop 305: Vouchers.”

10 Authors’ calculations of FY 2019 ESA program are based on data provided by the Arizona Department of Education, ADE FY 2017-2018 Arizona K-12 Enrollment Data, and FY 2017-2018 A-F Letter Grades. The State Board of Education calculates only school level A-F scores. District ratings were imputed using weighted averages.

11 Authors’ calculations of FY 2019 ESA program are based on data provided by the Arizona Department of Education, April 23, 2019, ADE FY 2017-2018 Arizona K-12 Enrollment Data, and FY 2017-2018 A-F Letter Grades. The State Board of Education calculates only school level A-F scores. District ratings were imputed using weighted averages. Average ESA award amounts exclude kindergarten students, who are weighted as 0.5 students in both the regular public school and ESA funding formulas.

12 2017 Census Poverty Data by Local Educational Agency: Arizona. Arizona Department of Education. Accessed June 20, 2019, http://www.azed.gov/titlei/census/.

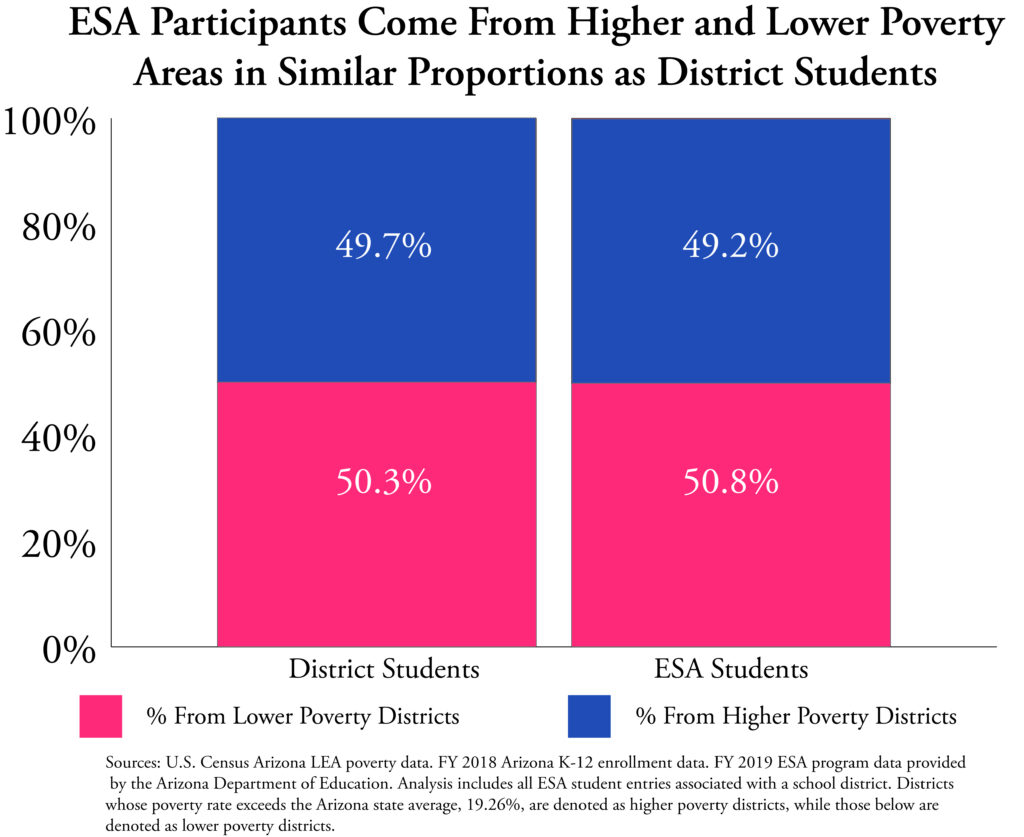
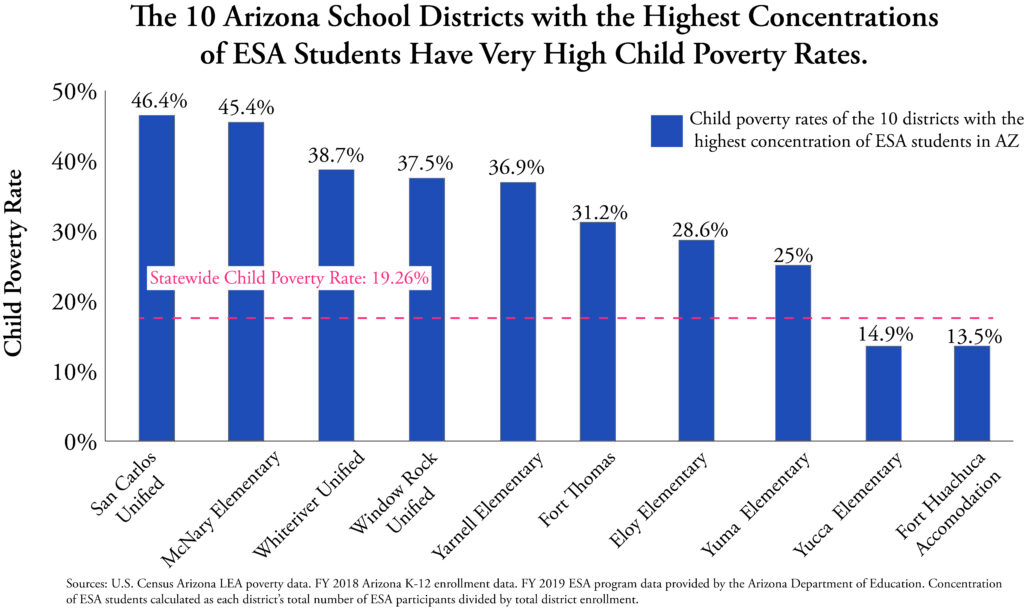
13 2017 Census Poverty Data by Local Educational Agency: Arizona. Arizona Department of Education. Accessed June 20, 2019. https://www.azed.gov/titlei/census/; FY 2018 Arizona K-12 Enrollment Data. Arizona Department of Education. https://www.azed.gov/accountability-research/data/; FY 2019 ESA program data provided by the Arizona Department of Education, April 23, 2019. Calculations include all ESA students identified by the Arizona Department of Education as being associated with a school district, rather than a charter school.

14 Arizona Department of Education, “2017 Census Poverty Data by Local Educational Agency: Arizona,” updated December 26, 2018, http://www.azed.gov/titlei/census/; Arizona Department of Education, “FY 2018 Arizona K-12 Enrollment Data,” https://www.azed.gov/accountability-research/data/; FY 2019 ESA program data provided by the Arizona Department of Education, April 23, 2019.

15 Beienburg, The Public School Benefits.

16 Arizona Auditor General, Arizona School District Spending, Fiscal Year 2018, March 2019, https://www.azauditor.gov/reports-publications/school-districts/multiple-school-district/report/arizona-school-district-3.

17 ADE FY 2017-2018 Arizona K-12 Enrollment Data, and FY 2017-2018 A-F Letter Grades.

18 Authors’ calculations of FY 2019 ESA program based on data provided by the Arizona Department of Education.

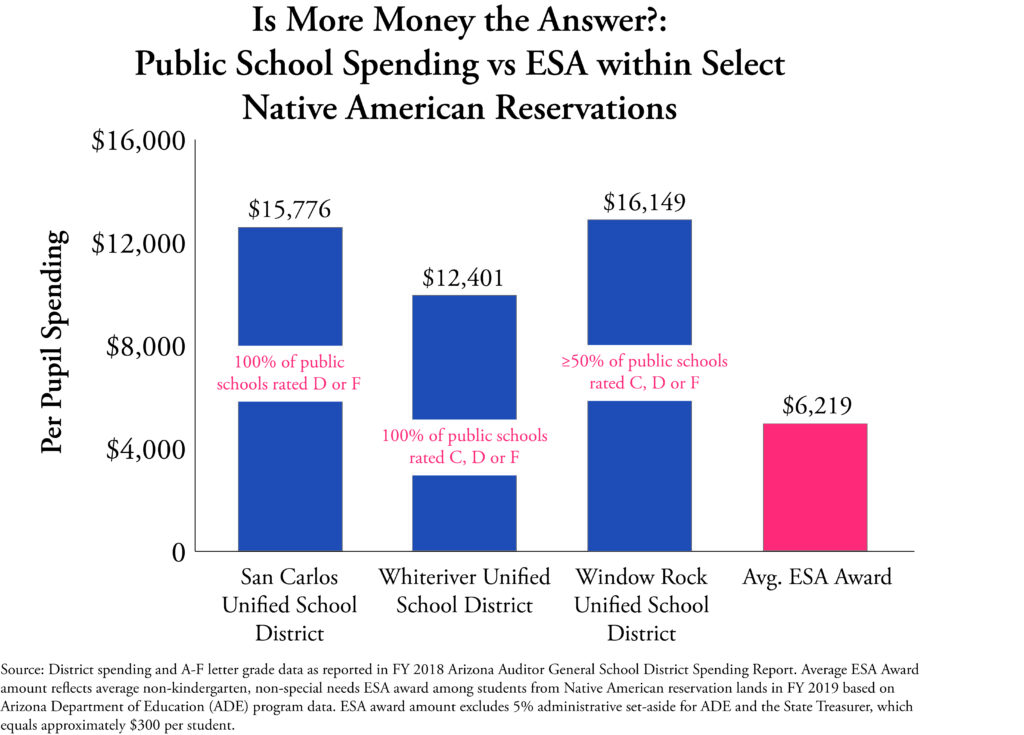
19 See, for example, St. Michael Indian School in Window Rock, Arizona. Tuition rates for grades K-12: $4,150-$4,825 per year: https://www.stmichaelindianschool.org/tuition_and_financial_aid.php.

20 Arizona Auditor General, Arizona School District Spending Report, Fiscal Year 2018, March 2019, https://www.azauditor.gov/reports-publications/school-districts/multiple-school-district/report/arizona-school-district-3.

21 FY 2019 ESA program data provided by the Arizona Department of Education.

22 Arizona Department of Education, “2017 Census Poverty Data by Local Educational Agency: Arizona,” updated December 26, 2018, http://www.azed.gov/titlei/census/.

23 Arizona Auditor General, Arizona School District Spending Report, Fiscal Year 2018, March 2019, https://www.azauditor.gov/reports-publications/school-districts/multiple-school-district/report/arizona-school-district-3.

Donate Now

Help all Americans live freer, happier lives. Join the Goldwater Institute as we defend and strengthen freedom in all 50 states.

Donate Now

Since 1988, the Goldwater Institute has been in the liberty business — defending and promoting freedom, and achieving more than 400 victories in all 50 states. Donate today to help support our mission.

We Protect Your Rights

Our attorneys defend individual rights and protect those who cannot protect themselves.

Need Help? Submit a case.

Get Connected to Goldwater

Sign up for the latest news, event updates, and more.